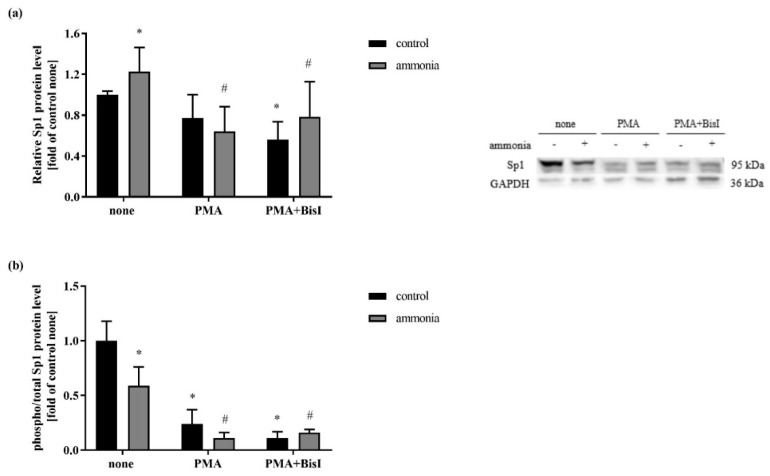
Figure 4.
(a) Sp1 protein level in the astrocytes treated with 5 mM ammonia for 24 h and 200 nM PMA and/or 1 µM BisI. Results are mean ± SD (n = 4). (*) p < 0.05 vs. control none; (#) p < 0.05 vs. ammonia none; Two-Way ANOVA and Bonferroni post-hoc test. (b) The ratio of phospho-Sp1 to the total Sp1 protein level in astrocytes treated with 5 mM ammonia for 24 h and 200 nM PMA and/or 1 µM BisI. Results are mean ± SD (n = 4). (*) p < 0.05 vs. control none; (#) p < 0.05 vs. ammonia none; Two-Way ANOVA and Bonferroni post-hoc test.

