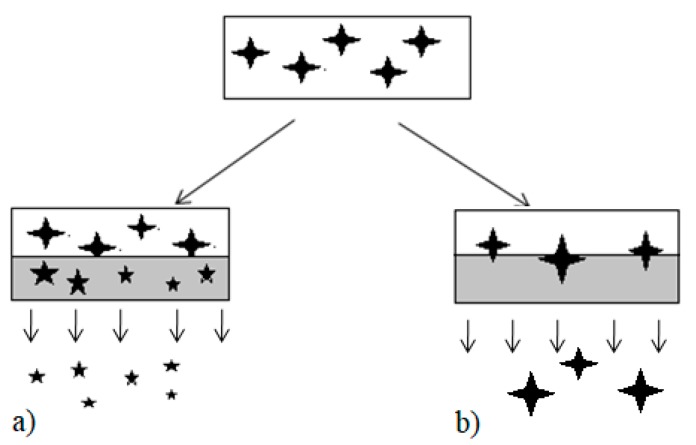
Figure 1.
Schematic diagram shows (a) Carrier-controlled dissolution and (b) drug-controlled dissolution (Adapted with permission from [11], copyright Elsevier, 2002). The larger  represents dissolved drug, the smaller
  represent the partially dissolved drug. Grey box represents an aqueous environment.

