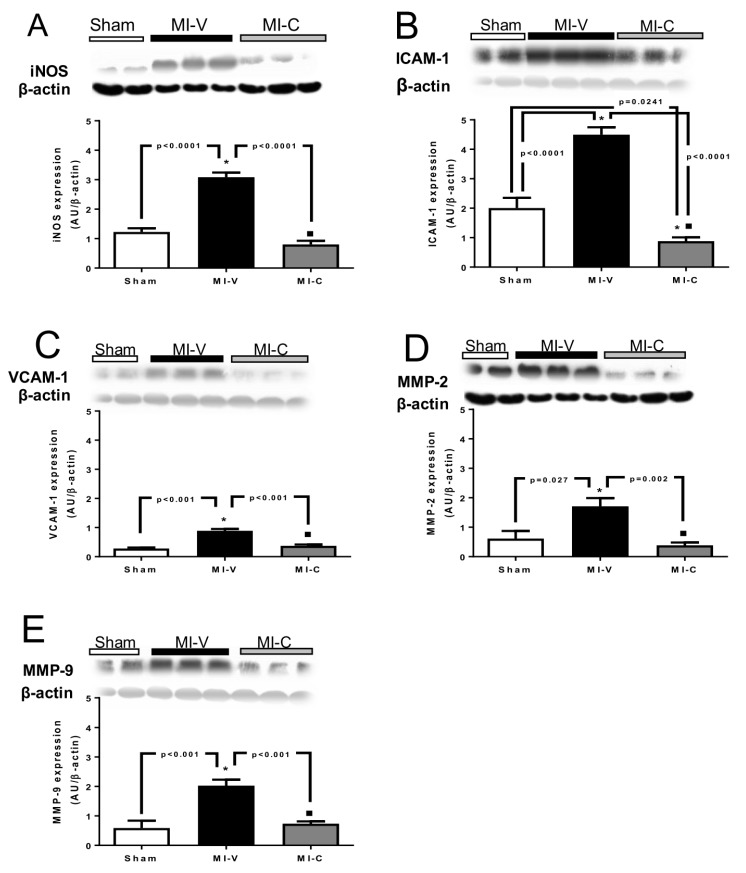
Figure 2.
Protein expression of (A) iNOS, (B) ICAM-1, (C) VCAM-1, (D) MMP-2, and (E) MMP-9 in Sham, myocardial infarction-vehicle (MI-V), and MI clofibrate-treated (MI-C) rats. Each panel shows a representative Western blot and densitometric analysis. β-actin was used as load control and for densitometric normalizing. Image corresponding to β-actin were re-used for illustrative purposes. Bars represent the mean ± standard error; n = 6 rats per group, ANOVA-Tukey * p < 0.05 vs. Sham and ■ p < 0.05 vs. MI-V.

