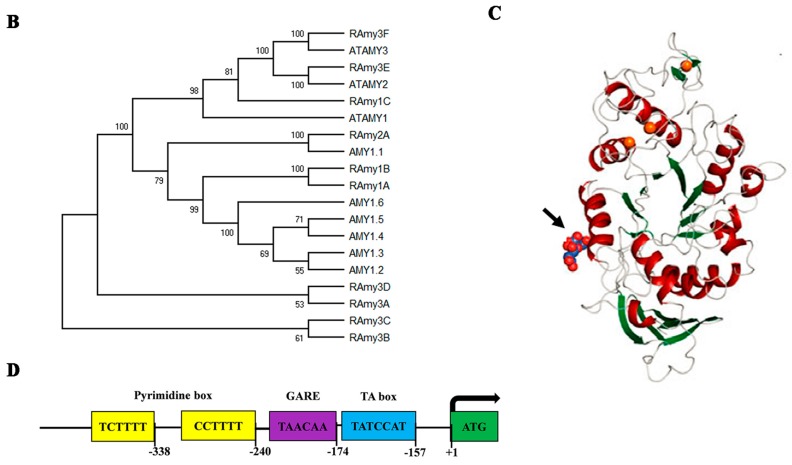
Figure 2.
(A) Gene structure of the 10 rice alpha-amylase genes. (B) Phylogenetic relationship between alpha-amylase isozymes in rice, barley (AMY1.1-AMY1.6), and Arabidopsis (ATAMY(1,2 and 3)) by the Neighbor joining method drawn using MEGA version X [56]. The genomic and protein sequences were obtained from the Rice Genome Annotation Project using LOC_Os02g52700, LOC_Os02g52710, LOC_Os01g25510, LOC_Os06g49970, LOC_Os09g28400, LOC_Os09g28420, LOC_Os08g36900, LOC_Os08g36910, LOC_Os04g33040, and LOC_Os01g51754 [64] for RAmy1A, RAmy1B, RAmy1C, RAmy2A, RAmy3A, RAmy3B, RAmy3C, RAmy3D, RAmy3E, and RAmy3F, respectively. The barley gene ID that was used for downloading the sequences was obtained from [64] and the sequences were downloaded from NCBI. For Arabidopsis, the sequences were downloaded from TAIR. (C) The overall crystal structure of Amy1A. Calcium ions are represented as orange balls, secondary carbohydrate binding site (SBS1 indicated by the black arrow) comprising of oxygen atoms (red balls) and carbon atoms (deep blue shape), (cited from [57]) (D) Schemes of Constructs for the representative promoter of Amy1A.


