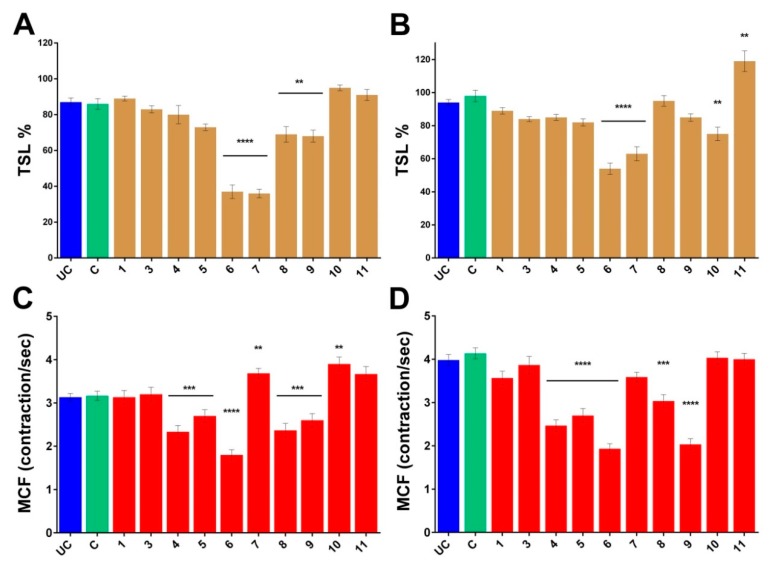
Figure 5.
Normalized rotifer characteristics. Changes in the TSL values of the Philodina acuticornis after 3-day treatment (A) without feeding and (B) with feeding, compared to the group C. Changes in the MCF values of the Philodina acuticornis after 3-day treatment (C) without feeding and (D) with feeding, compared to the group C. UC: untreated control, C: control with 0, 1% DMSO. 1, 3–11: compounds. TSL: toxicity and survival lifespan (n = 12, well). MCF: mastax contraction frequency (n = 30, individual rotifer). Values are the mean ± SEM; p ** ≤ 0.01, p *** ≤ 0.001 and p **** ≤ 0.0001.

