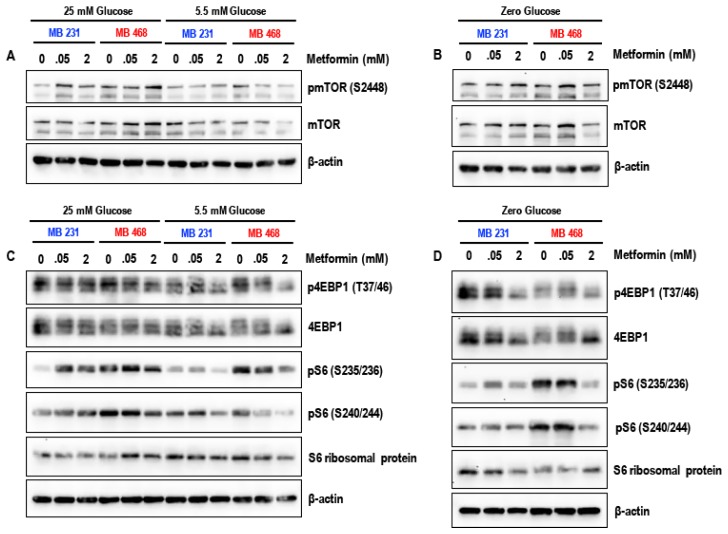
Figure 5.
Side-by-side comparison between MDA-MB-231 and MDA-MB-468 cells. Representative western blots (A) show the effect of metformin (50 μM and 2 mM) in 25 mM glucose and 5.5 mM glucose on the levels of pmTOR (S2448) and mTOR in MDA-MB-231 and MDA-MB-468 cells, (B) show the effect of metformin (50 μM and 2 mM) in zero glucose/glucose-starved condition on the levels of pmTOR (S2448) and mTOR in MDA-MB-231 and MDA-MB-468 cells, (C) show the effect of metformin (50 μM and 2 mM) in 25 mM glucose and 5.5 mM glucose on the levels of p4EBP1 (T37/46), 4EBP1, pS6 (S235/236), pS6 (S240/244), and S6 ribosomal protein in MDA-MB-231 and MDA-MB-468 cells, and (D) show the effect of metformin (50 μM and 2 mM) in zero glucose/glucose-starved condition on the levels of p4EBP1 (T37/46), 4EBP1, pS6 (S235/236), pS6 (S240/244), and S6 ribosomal protein in MDA-MB-231 and MDA-MB-468 cells. β-actin was used as the loading control.

