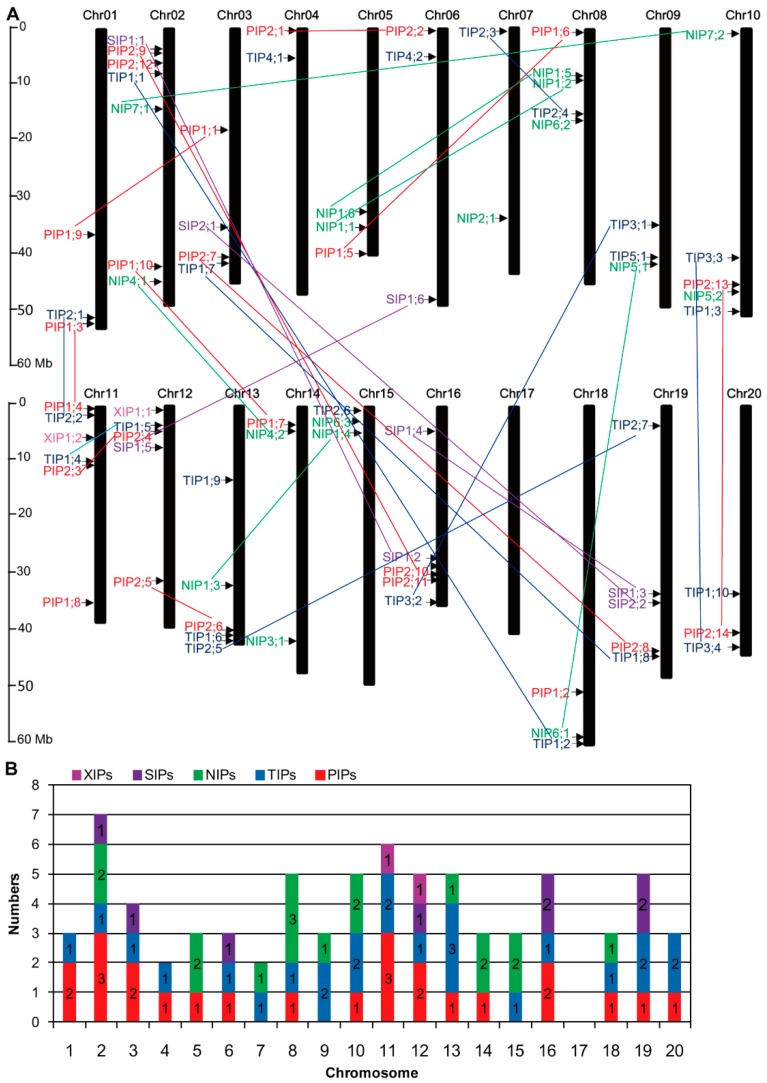
Figure 1.
Chromosomal distribution of soybean AQP genes. (A) Graphical representation of physical locations for each AQP gene on soybean chromosomes (numbered Chr01–20). The scale on the left indicated the genomic length in megabases (Mb). PIPs, TIPs, NIPs, XIPs and SIPs were indicated with red, blue, green, purple and pink fonts, respectively. Lines represented putative gene duplications. (B) Numbers of PIPs, TIPs, NIPs, XIPs and SIPs on each soybean chromosome.

