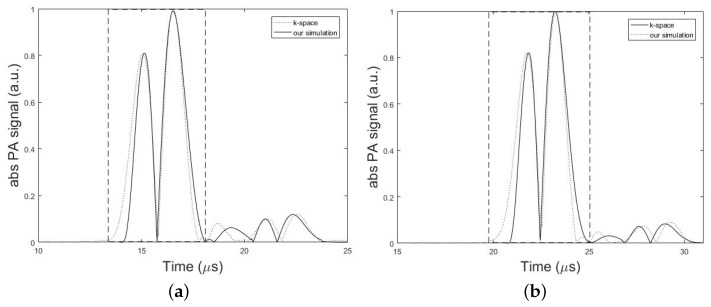
Figure 5.
Numerical validation of the proposed method versus the k-space algorithm. Absolute PA signal profiles simulated by k-space algorithm (dotted line) and our simulation method (solid line). Dashed rectangles show the main bipolar pulse of the simulated PA signal. In these simulations, the setup in Figure 2 with the parameters, h = 7 mm, k = 10 mm, = 1 mm, = 0.025 inch, and T = 5 cm is used. (a) Minimum error of 0.11% obtained for d = 1.7 cm. (b) Maximum error of 0.25% obtained for d = 2.7 cm.

