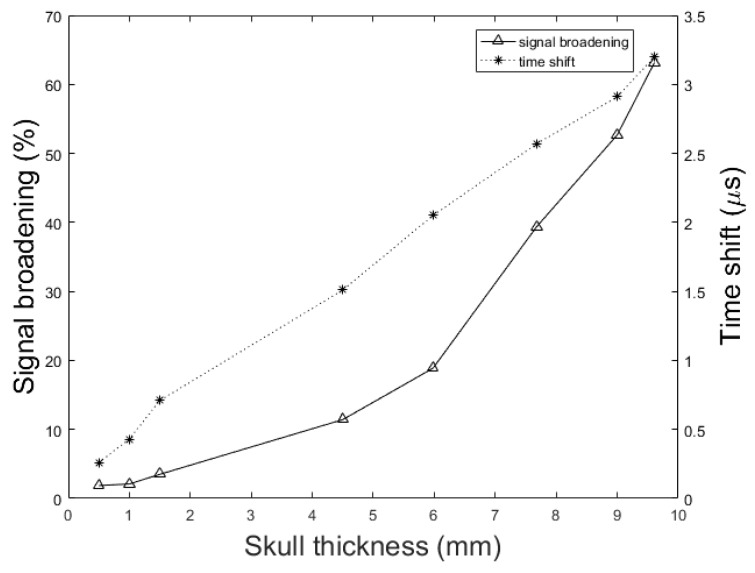
Figure 10.
Simulation results of the effect of skull thickness on the signal broadening (solid line) and time shift (dotted line) of transcranially recorded signal relative to the undisturbed signal. In these simulations, the setup in Figure 2 with the parameters, d = 1.7 cm, k = 10 mm, = 1 mm, = 0.25 inch, and T = 5 cm is used. The thicknesses of the skull are as follow; 0.5 mm, representing mouse skull thickness, 1 mm, representing rat skull thickness, 1.5 mm, representing neonatal skull thickness, 4.5 mm, representing dog frontal skull thickness, 5.98 mm, and 7.68 mm, representing human frontal skull thickness, 9 mm, representing dog parietal skull thickness, and 9.61 mm, representing human frontal skull thickness.

