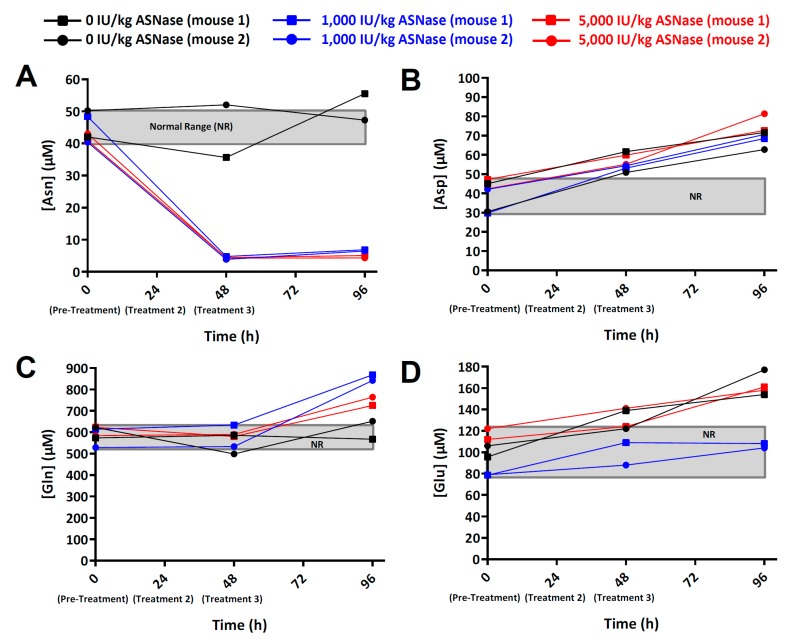
Figure 3.
Amino acid concentration (µM) versus time (h) in whole blood of mice treated with ASNase. (A) asparagine (Asn), (B) aspartic acid (ASP), (C) glutamine (Gln), and (D) glutamic acid (Glu). Each data series represents an individual mouse, and the mice were arranged into the following three cohorts that were given intraperitoneal injections of either vehicle (1x PBS) or ASNase at 0, 24, and 48 h: (1) Control mice (n = 2; blackline with black squares and circles); (2) mice treated with 1000 IU/(kg·day) ASNase (n = 2; blue lines with blue squares and circles); (3) mice treated with 5000 IU/(kg·day) ASNase (n = 2red lines with red squares and circles). ASNase was administered at 0, 24, and 48 h, and whole blood (10 µL) was collected from each mouse at 0, 48, and 96 h, and was processed as described. The gray box represents the NR levels of Asn, Asp, Gln, and Glu defined by the 0 h (pre-treatment) samples.

