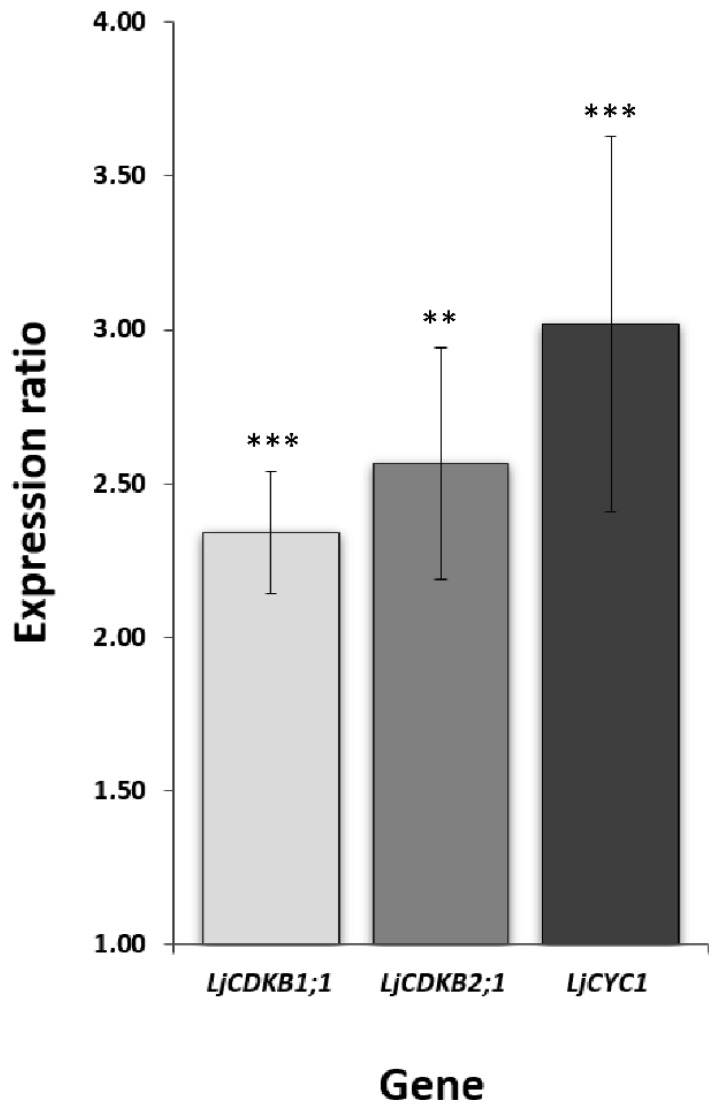
Figure 7.
Relative expression level of G2-M phase cell cycle markers. The expression values for root nodules at 54 dpi were set as unity for each tested gene and the expression level in the nodules formed at 20 dpi was proportionally converted. Mean values (±SE) were derived from three biological replicates, for which three individual qPCR reactions were performed (n = 9). Asterisks above the bars represent a statistically significant difference in comparison to expression values in the nodules formed 54 dpi, at the level p < 0.01 (**) or p < 0.001 (***).

