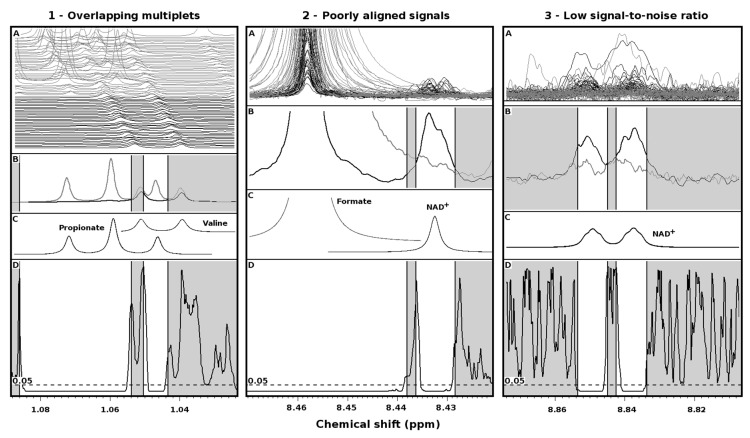
Figure 2.
Performance of procedure for the reconstruction of signals by means of point-by-point univariate analysis, represented in the three particularly challenging cases of overlapping multiplets (1), poorly aligned signals (2) and low signal-to-noise ratio (3). Superimposition (A) and average (B) of portions of the spectra acquired on healthy (black line) and BV-affected (light gray line) women. (C) Simulation of the main signals appearing in such portions. (D) P-values of the point-by-point Wilcoxon tests. White portions identify the reconstructed signals.

