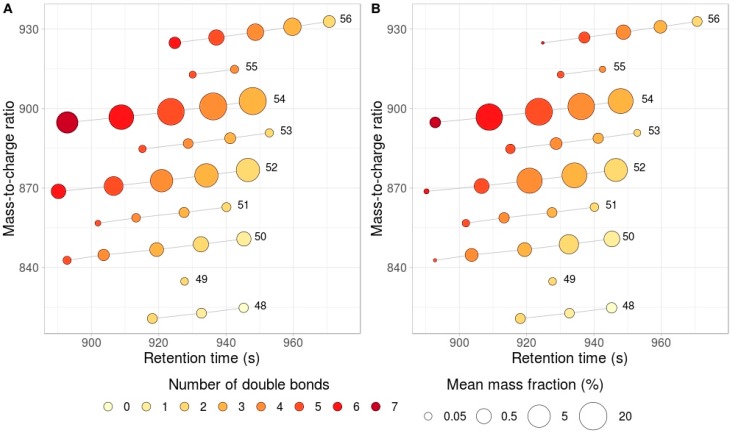
Figure 1.
Retention time –mass to charge plot for (A) rapeseed and (B) sunflower. Single dot corresponds to a single triglyceride, retention time (seconds) and m/z are shown on x- and y-axis, respectively. Color scale represents the number of double bonds. Circle size represents the mass fraction. Grey lines connect TAGs with the same fatty acids carbon chain length (indicated at the right end of each line).

