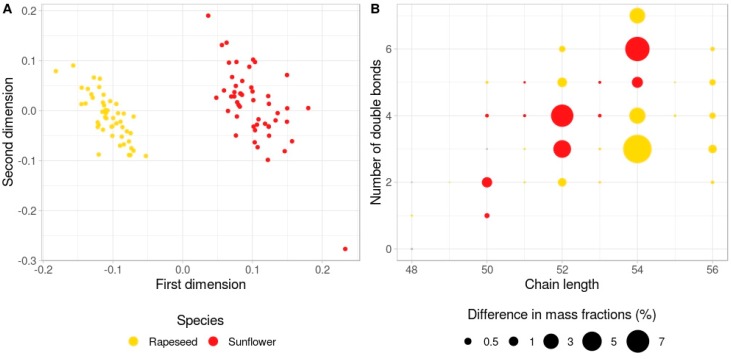
Figure 2.
Triglyceride comparison between sunflower and rapeseed. (A) Multidimension scaling plot (one minus Spearman correlation coefficient was used as the distance, two dimensions) of samples demonstrating a clear segregation of rapeseed and sunflower samples. (B) The difference in the TAG mass fractions between rapeseed and sunflower. Color indicates which species possess a higher amount of a certain TAG. Circle size represents the absolute difference in mass fractions. Grey circles correspond to the TAGs that do not show statistically significant differences.

