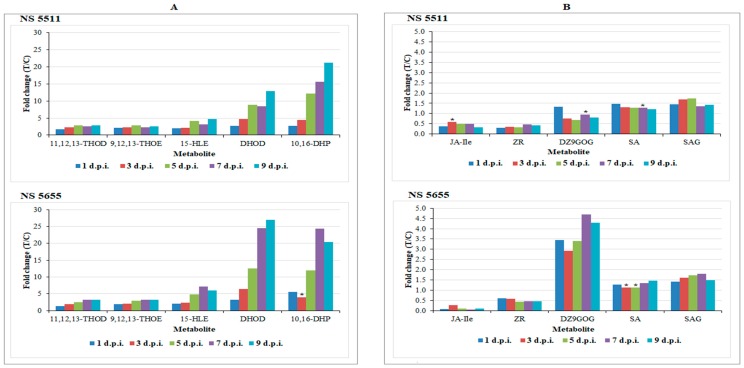
Figure 5.
Relative quantification of fatty acids (A) and phytohormones (B) annotated in sorghum leaves responding to infection by B. andropogonis. The relative levels of each metabolite are expressed as fold changes, computed from treated against control (T/C) samples, where fold change > 1 represents significant accumulation in NS 5511 (BT) and NS 5655 (ST). Abbreviations: (A) 11,12,13-THOD = 11,12,13-trihydroxy-9,15-octadecadienoic acid; 9,12,13-THOE = 9,12,13-trihydroxy-10-octadecenoic acid; 15-HLE = 15-hydroxylinoleic acid; DHOD = dihydroxy-octadecadienoic acid; 10,16-DHP = 10,16-dihydroxypalmitate (B) JA-Ile = jasmonoyl-l-isoleucine; ZR = zeatin riboside; DZ9GOG = dihydrozeatin-9-N-glucoside-O-glucoside; SA = salicylic acid; SAG = salicylic acid 2-O-beta-d-glucoside. The fold changes on the various treatment days presented in the graphs have a p-value < 0.005, except for the ones indicated by * with p-value > 0.005, but < than 0.05.

