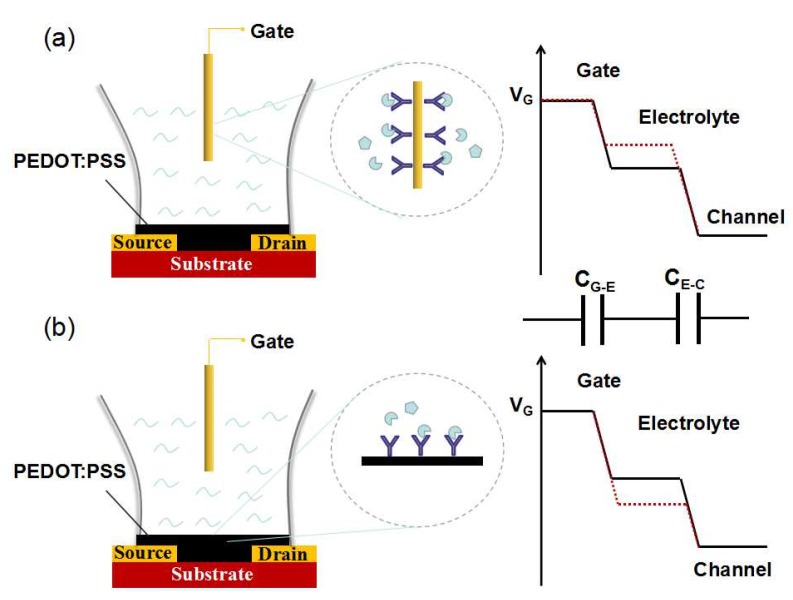
Figure 2.
Schematic diagram of an OECT: (a) gate surface as the sensing interface, the potential distribution between gate and channel is changed by the reaction on the gate; (b) channel surface as the sensing interface, the potential distribution between the gate and channel is changed by the reaction on the channel.

