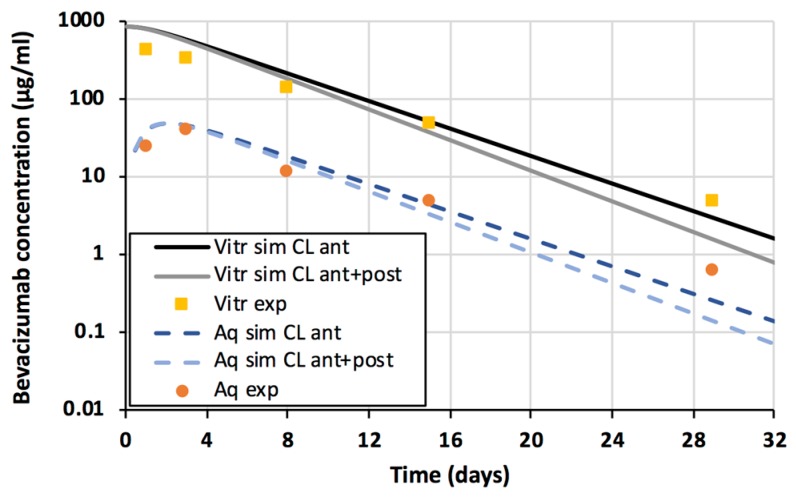
Figure 3.
Experimental (symbols) and simulated (lines) bevacizumab concentrations in the vitreous (yellow squares) and aqueous humor (orange spheres). The simulated vitreal and aqueous humor concentrations with only anterior clearance are shown as a black solid line and a dark blue dashed line, respectively. The simulated vitreal and aqueous humor concentrations with anterior and posterior clearance are shown as a grey solid line and a light blue dashed line, respectively.

