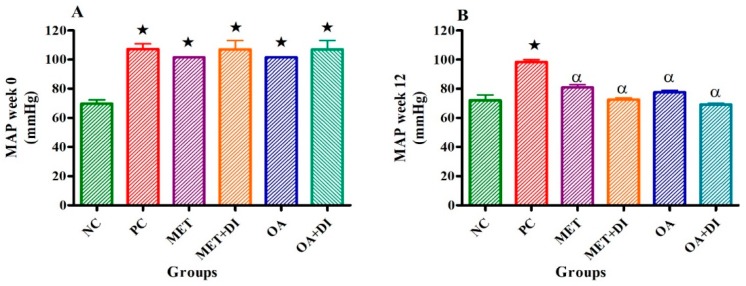
Figure 2.
Effects of OA and Met (n = 6, per group) on mean arterial pressure of rats that continued with HFHC diet and those that changed diet or had diet intervention at week 0 (A) and week 12 (B) respectively. Values are presented as standard error of mean ± SEM.  = p < 0.05 denotes comparison with NC; α = p < 0.05 denotes comparison with PC.

