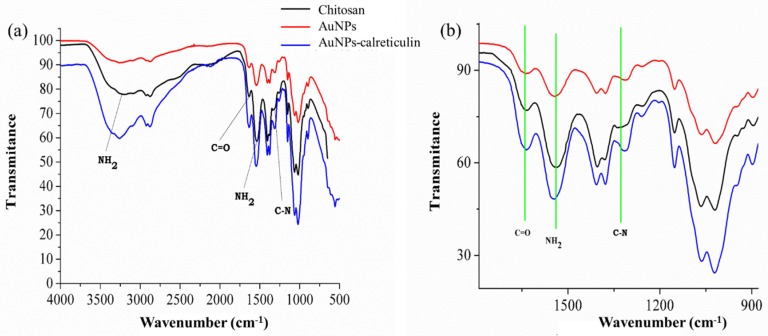
Figure 2.
IR spectrum of chitosan, AuNPs, and AuNPs–calreticulin. (a) Characteristic peaks of chitosan were observed. (b) Detail of attenuated total reflection (ATR)– Fourier transform infrared spectroscopy (FTIR) spectra between 900–1600 cm−1 shows the principal peak shifts of the interaction between calreticulin and chitosan.

