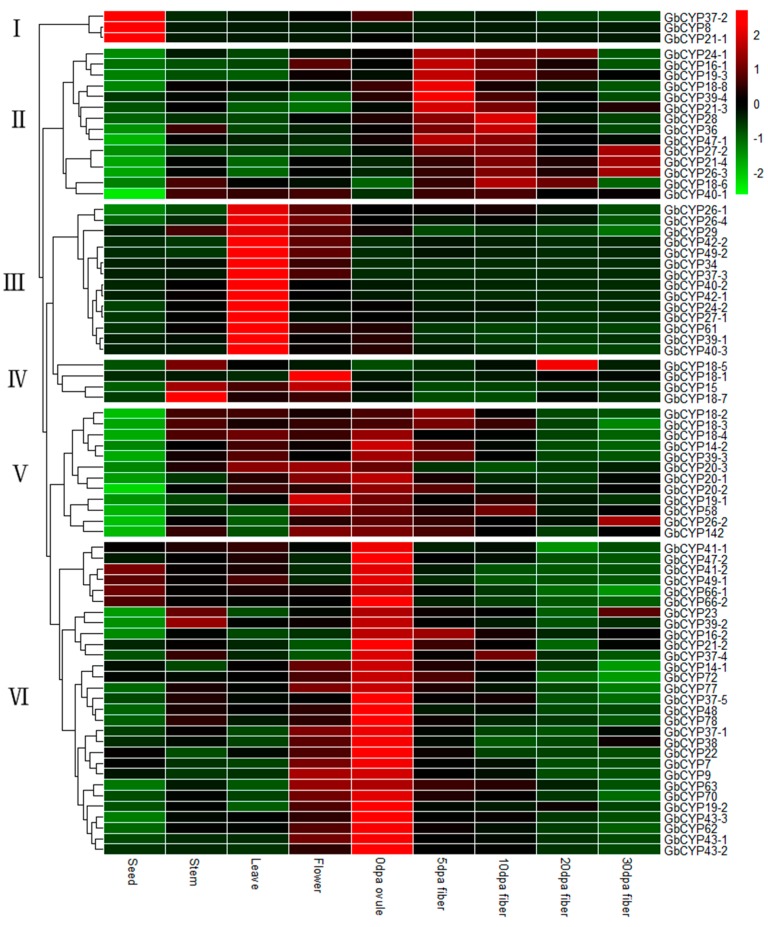
Figure 7.
Expression patterns of GbCYP genes in different tissues. Nine tissues comprising seeds, stems, leaves, flowers, 0 days postanthesis (DPA) ovules, and 5, 10, 20 and 30 DPA fibres were investigated. Scale bars represent the log2 transformations of the RPKM values. The results can be classified into six pattern groups (I–VI).

