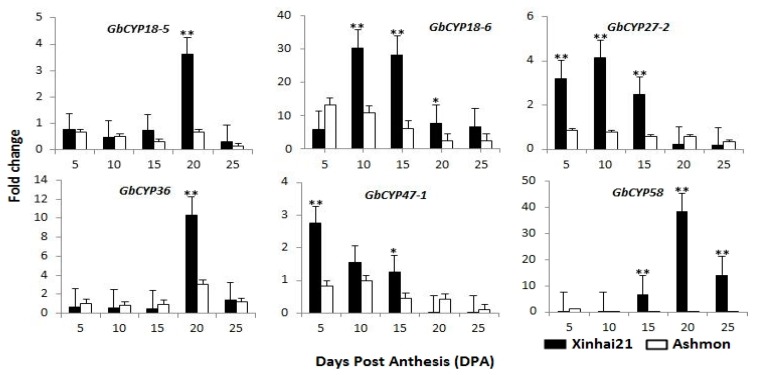
Figure 9.
Expression profiles of six GbCYPs between Xinhai21 and Ashmon based on qRT-PCR. GbUBQ7 was used as an internal reference to normalise the expression data. Error bars were calculated from the difference in the expression patterns of three biological replicates. The asterisks and double asterisks indicate correlations at the 0.05 and 0.01 significance levels, respectively (t-test, * p < 0.05, ** p < 0.01).

