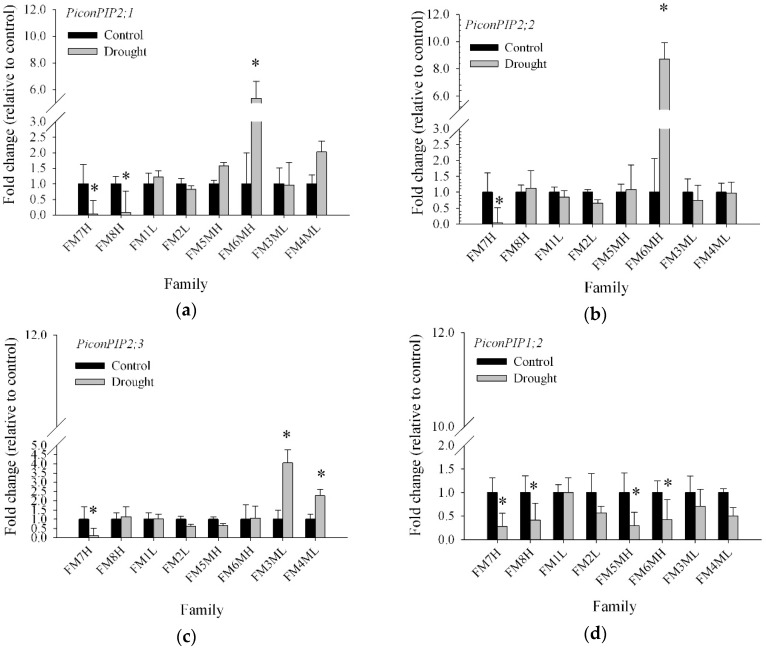
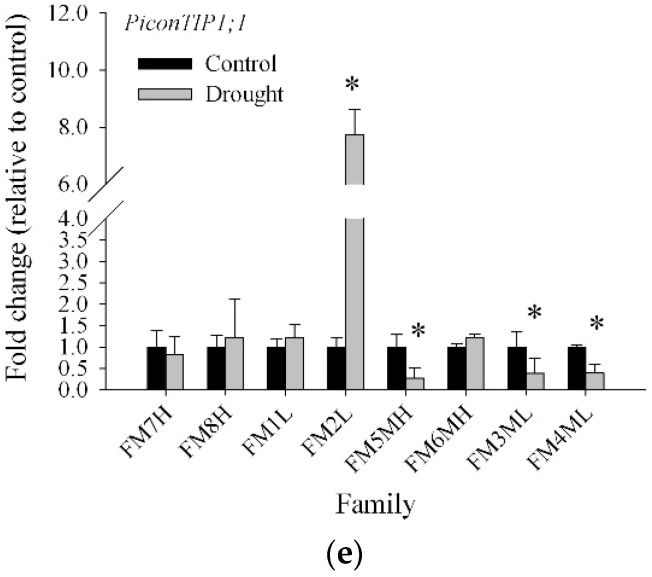
Figure 4.
Relative mRNA levels of five aquaporin genes of eight families in Pinus contorta roots (expressed as fold change from control) (a) PiconPIP2;1; (b) PiconPIP2;2; (c) PiconPIP2;3; (d) PiconPIP1;2; and (e) PiconTIP1;1. Values are for control and drought-stressed plants. Mean values with the asterisks indicate significantly different at p ≤ 0.05. Error bars on each column indicate the standard deviation from four biological (seedling) replicates.


