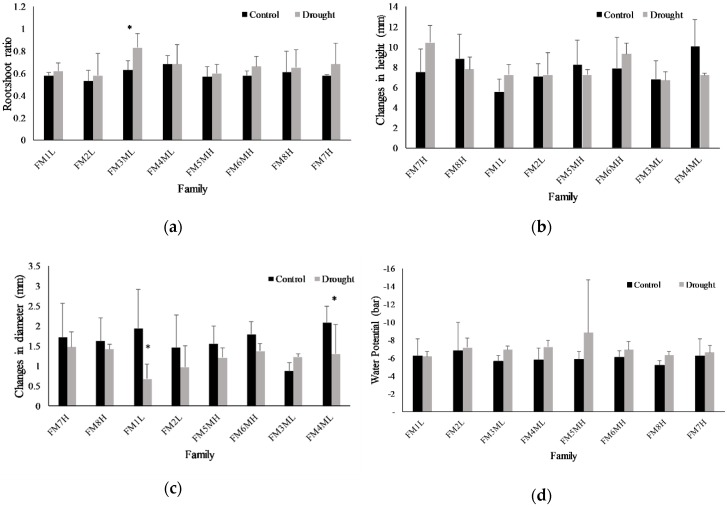
Figure 7.
(a) Root:shoot ratios of dry biomass, (b) changes in height, and (c) changes in root collar diameter of eight Pinus contorta families exposed to two watering treatments: well-watered controls and drought. Values are means plus the standard deviation with four biological replications. Mean values with the asterisks indicate significant difference at p ≤ 0.05. (d) Plant water potential (bars + SD; n = 4) at 63DAT just prior to harvesting for control and drought treated Pinus contorta seedlings.

