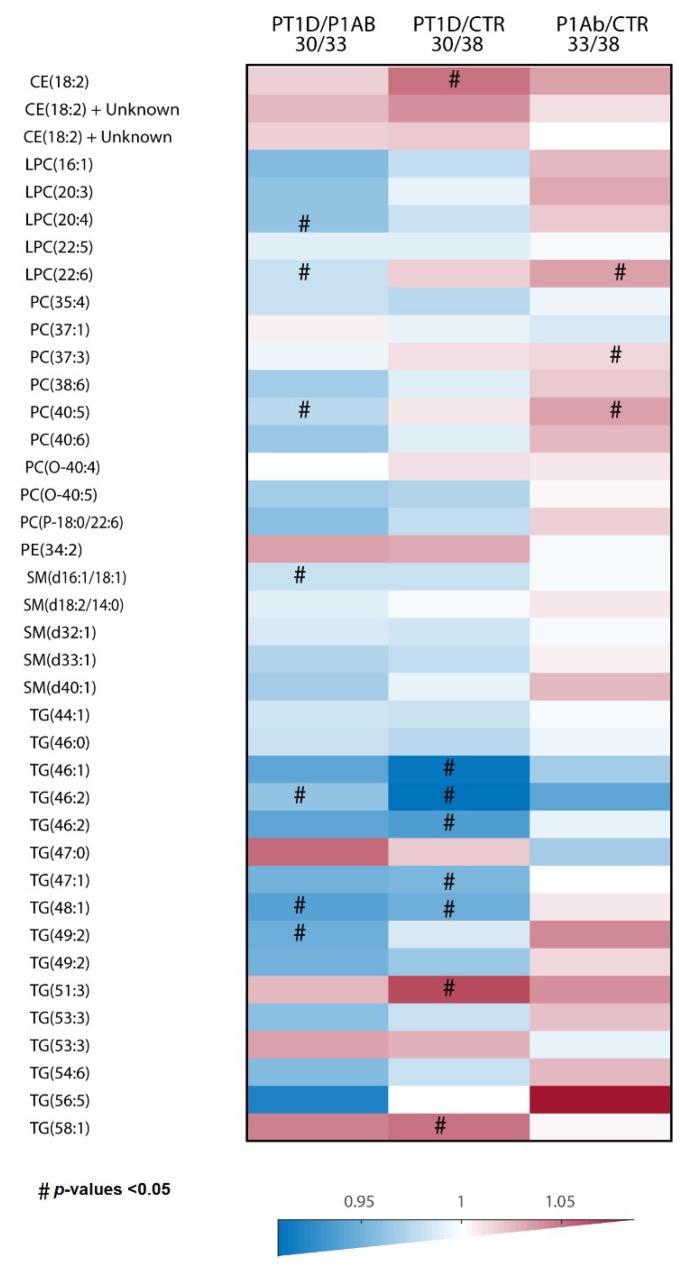
Figure 1.
The differences in global cord plasma lipidome between the three study groups. Heat map showing 40 lipid species representative of lipid classes that change between PT1D, P1Ab and CTR. Differences in lipid concentrations were calculated by dividing the mean concentration in PT1D by the mean concentrations in P1Ab and CTR. # represents the p-values <0.05. Abbreviations: cholesterol ester (CE), phosphatidylcholine (PC), phosphatidylethanolamine (PE), sphingomyelin (SM), and triacylglycerol (TG), lysophosphatidylcholines (LPC).

