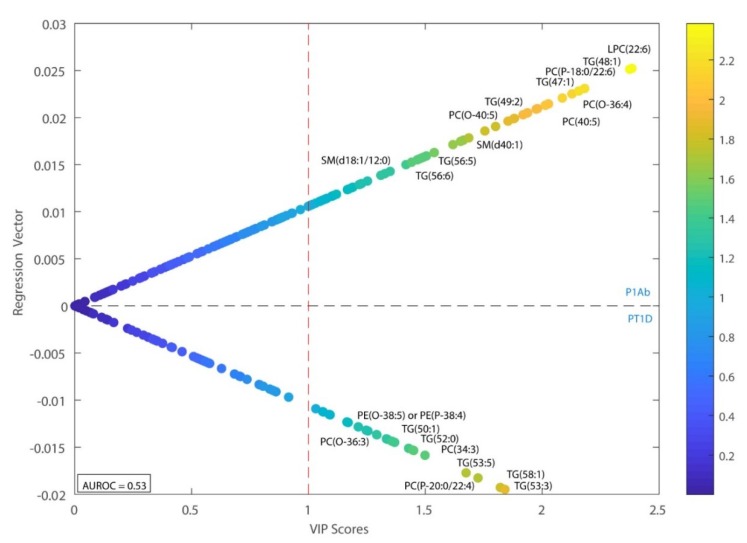
Figure 2.
Regression coefficient plot from partial least square discriminant analysis (PLS-DA). This plot has the regression coefficient on the y-axis and variable importance in projection (VIP) scores on the x-axis. The positive and negative regression coefficients represent P1Ab and PT1D groups, respectively. Abbreviations: diacylglycerol (DG), lysophosphatidylcholine (LPC), area under the receiver operating characteristic curve (AUROC).

