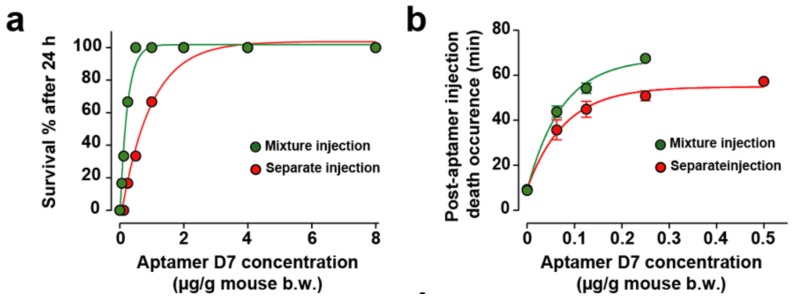
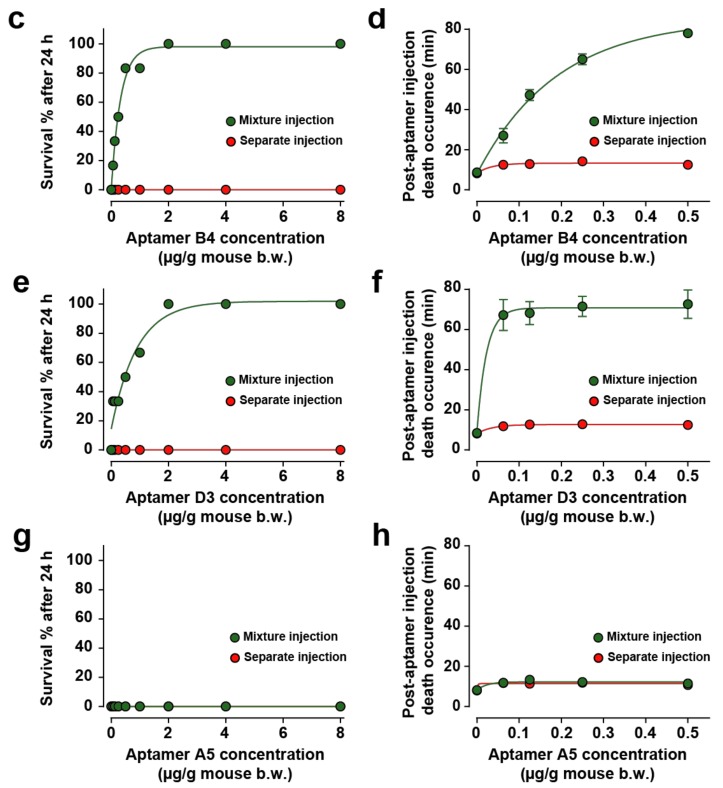
Figure 4.
In vivo evaluation of aptamer neutralization properties. (a,b) Dose-response curve illustrating aptamer D7 neutralization properties on death rescue (a) and latency to death (b). One set of data was previously published in [8]. (c,d) Dose-response curve illustrating aptamer B4 neutralization properties on death rescue (c) and latency to death (d). (e,f) Dose-response curve illustrating aptamer D3 neutralization properties on death rescue (e) and latency to death (f). (g,h) Dose-response curve illustrating aptamer A5 neutralization properties on death rescue (e) and latency to death (f). Aptamers and toxin were administrated by intraperitoneal injection (mixture injection condition, green symbols and lines) or aptamers were injected by the intravenous route 1 min after intraperitoneal toxin injection (red symbols and lines). For each aptamer, αC-conotoxin PrXA concentration of 0.5 µg/g of mouse body weight was used. n = 6 mice for each aptamer concentration. n = 54 mice for each route of administration.


