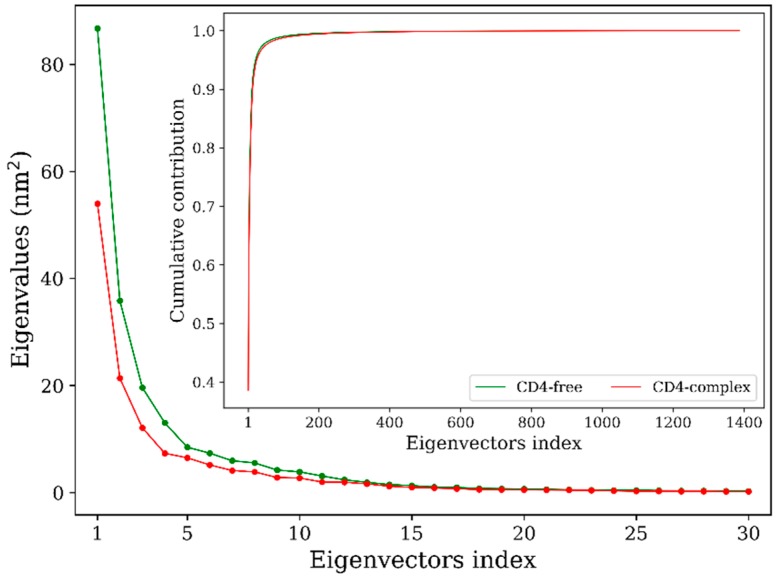
Figure 4.
Eigenvalues as a function of eigenvector index obtained from principal component analyses of the joined equilibrium trajectories of the CD4-free (green line) and CD4-complexed (red line) gp120s. Main plot shows the eigenvalues of only the first 30 eigenvectors; inset plot is the cumulative contribution of all eigenvectors to the total mean square fluctuations.

