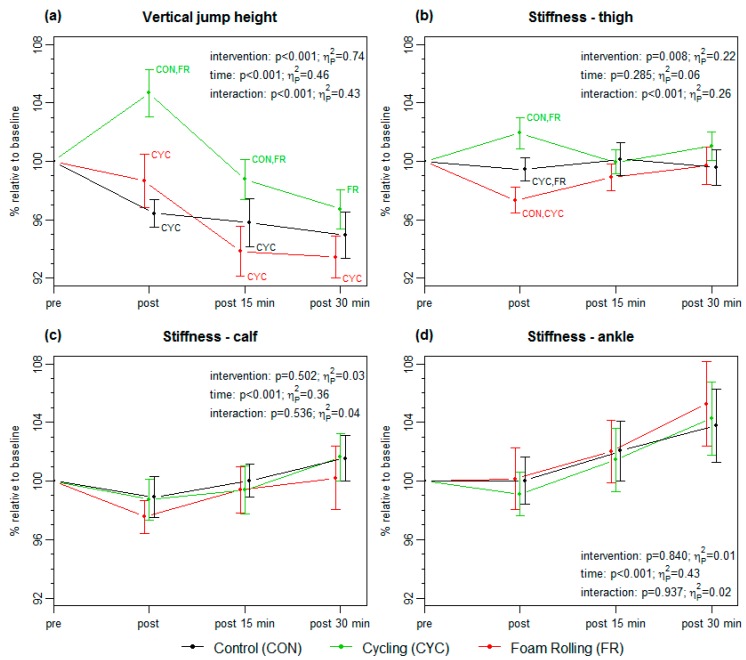
Figure 3.
Percentage changes (mean ± 90% CI) in vertical jump height (a) and stiffness measurements at the thigh (b), calf (c), and ankle (d). The results of the two-way repeated measure ANOVAs (time x intervention) are shown within each plot. Within intervention comparisons using one-way repeated measure ANOVAs with Bonferroni post hoc tests revealing significant differences in vertical jump height (post p < 0.001, ηP² = 0.58; post 15 min p < 0.001, ηP² = 0.33; post 30 min p = 0.005; ηP² = 0. 25) and thigh stiffness (post p < 0.001, ηP² = 0.45).

