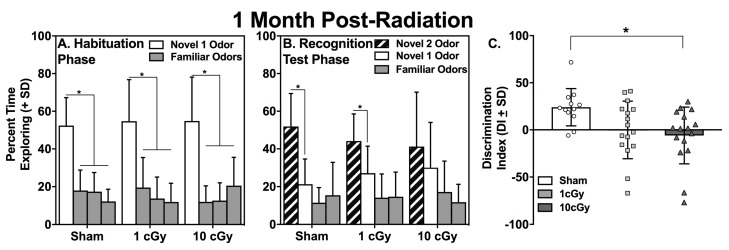
Figure 1.
Mean percentage of exploration (+SD) of novel and familiar odors for sham (n = 12), 1 cGy (n = 16), and 10cGy (n = 16) 16O ion exposed rats on (A) Trial 1 of Habituation and (B) Trial 1 of the Recognition Test, one month following exposure. All rats displayed a significantly greater percentage of exploration of the novel 1 odor on Habituation compared to the familiar odors (* p < 0.05). Sham and 1 cGy-exposed rats displayed significantly greater exploration of the novel 2 odor during the Recognition Test (* p ≤ 0.05). Each group of bars in A and B represents mean percentage of exploration of the four odor-impregnated wooden beads during either Habituation or the Recognition Test. Solid white bars: novel 1 odor. Solid gray bars: familiar odors. Hatched bars: novel 2 odor. (C) The 10 cGy-exposed rats displayed a discrimination index significantly less than the sham rats (* p < 0.05); bars represent group averages and symbols represent individual animals.

