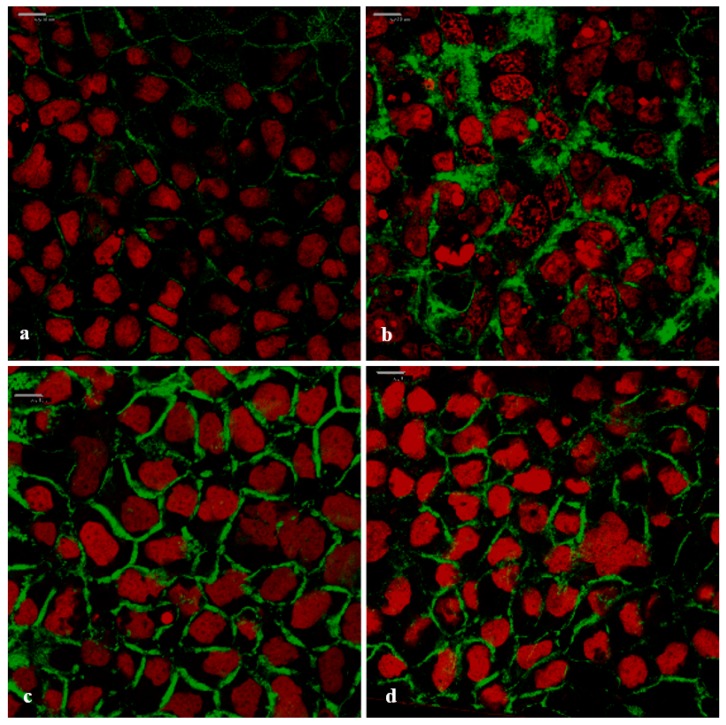
Figure 9.
Confocal micrograph images of the filamentous actin (F-actin) distribution in the Caco-2 cell monolayers (green: F-actin stained with CytoPainter® Phalloidin iFluor 488 and red: cell nuclei stained with propidium iodide). (a) Negative control (untreated Caco-2 cell monolayer), (b) positive control (0.5% w/v TMC), (c) 1.0% w/v A. vera gel, and (d) 1.0% w/v A. vera whole-leaf extract (Scale bars represent 10 µm).

