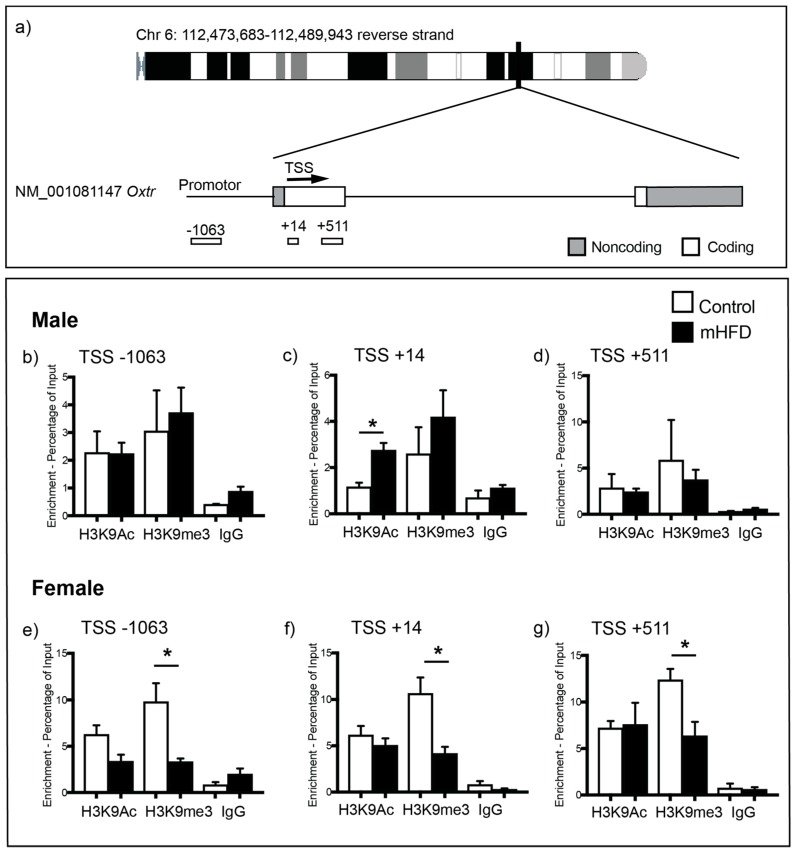
Figure 2.
(a) ChIP-qPCR primers targeting regions up and downstream of the Oxtr transcription start site (TSS). (b–d) Bar graphs show H3K9Ac, H3K9me3 and IgG (control) binding at the Oxtr promoter region of control and mHFD male offspring hippocampus at: (b) −1063; (c) +14; and (d) +501 base pairs from the TSS. (e–g) Graphs show H3K9Ac, H3K9me3 and IgG (control) binding at the Oxtr promoter region of control and mHFD female offspring hippocampus at: (e) −1063; (f) +14; and (g) +501 base pairs from the transcription start site. Data are expressed as mean log2 ChIP/input ± SEM of three independent experiments, as analyzed by unpaired t-test, with p ≤ 0.05 *.

