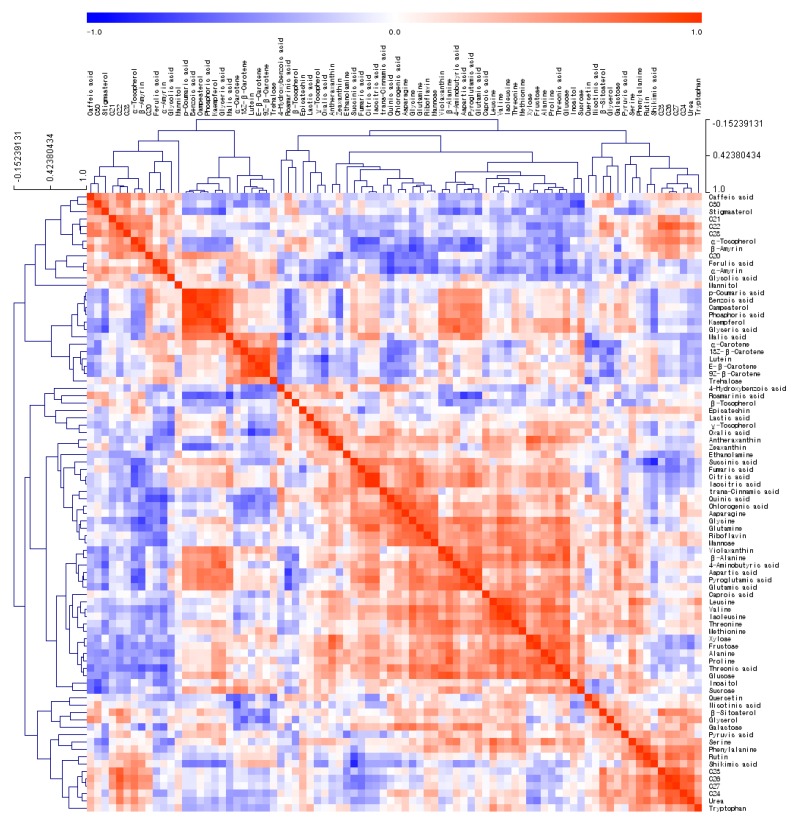
Figure 4.
Hierarchical clustering analysis (HCA) of compound data from the nine Mentha spp. Each square indicates the Pearson’s correlation coefficient of a pair of compounds and the value of the correlation coefficient is represented by the intensity of blue or red colors, as indicated on the color scale. C20, eicosanol; C21, heneicosanol; C22, docosanol; C23, tricosanol; C24, tetracosanol; C26, hexacosanol; C27, heptacosanol; C28, octacosanol; C30, triacontanol.

