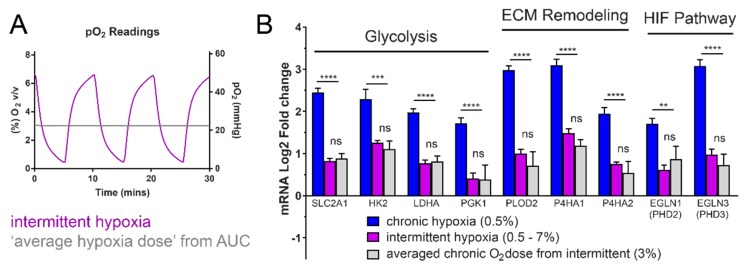
Figure 5.
Hypoxia dose-dependent effect of intermittent hypoxia. (A) The area under the intermittent hypoxia curve (purple) was calculated using the measured pericellular oxygen values, to determine the ‘average’ dose of hypoxia (grey). (B) The equivalent chronic hypoxia dose at 3% leads to the same increase in HIF-target gene expression. The expression data from Figure 2B was compared to expression under 3% hypoxia conditions. 3% oxygen is the ‘averaged hypoxic dose’ equivalent to the same amount of oxygen given in one full cycle of intermittent hypoxia, but administered as a constant dose. The average hypoxia dose was calculated using the area under the curve from oxygen measurements in (A). Horizontal bars indicate comparison between chronic hypoxia (0.5%) and averaged intermittent hypoxia dose (3%). Results are the mean ± SEM of independent experiments run in duplicate (n ≥ 3). ** p < 0.01, ns = not significant, *** p < 0.001 and **** p < 0.0001.

