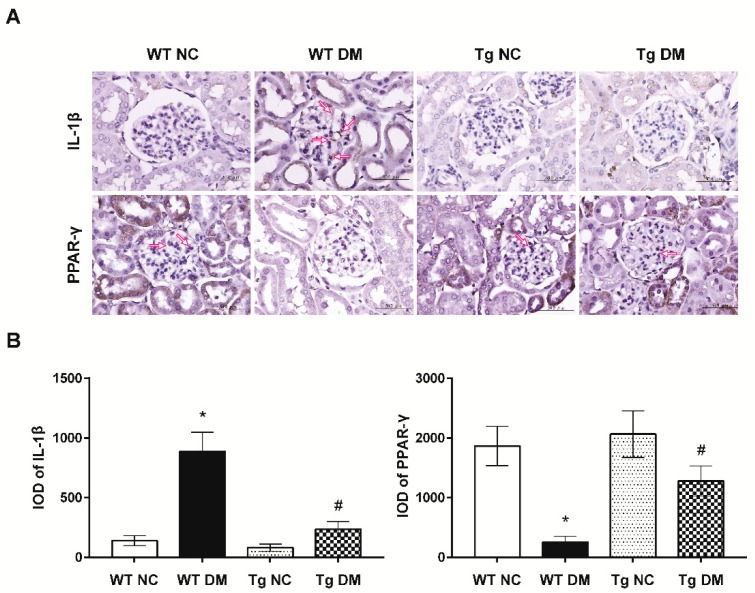
Figure 3.
(A) Representative photographs of the immunohistochemical (IHC) staining for IL-1β and PPAR-γ in the renal cortex of study animals. Arrows indicate positive staining over mesangial cells or the mesangium. (B) The integrated optical density (IOD) of IL-1β and PPAR-γ IHC-stained materials were analyzed utilizing the Image Pro Plus software. IOD = optical intensity of positive cells × area of positive cells. Data from histomorphometric analysis are presented as means ± standard errors calculated from six independent experiments. The symbol * indicates significant difference vs. the WT NC group (p < 0.05); the symbol # indicates significant difference vs. the WT DM group (p < 0.05).

