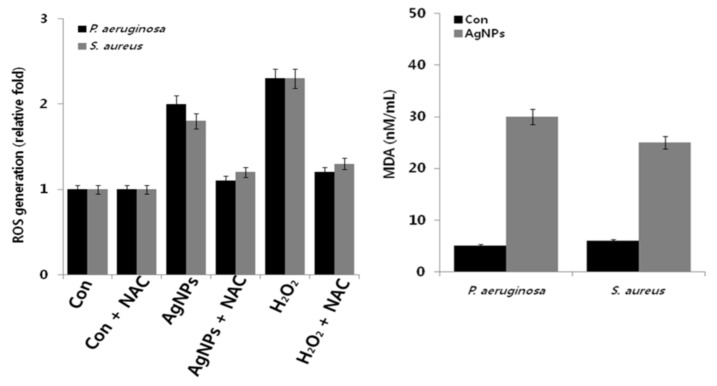
Figure 12.
Effects of AgNPs on ROS (left panel) and MDA (right panel) levels. Results were expressed as means ± SD of n = 3; p < 0.05 was considered statistically significant as compared to control (con) groups. Reproduced from [107], MDPI under the Creative Commons Attribution License.

