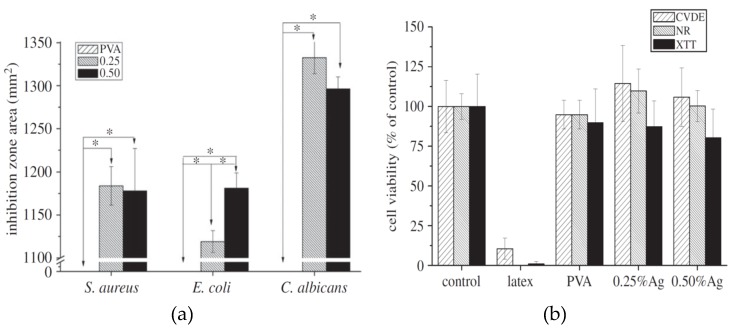
Figure 16.
(a) Inhibition zones of all samples exposed to S. aureus, E. coli and C. albicans. There is a significant difference between the levels indicated by arrows, * p < 0.05. (b) Cell viability of mouse fibroblasts after 24 h incubation with nanocomposite hydrogels. CVDE (cell density), NR (membrane integrity assay) and XTT (mitochondrial activity). ‘Control’ is the negative control, whereas ‘latex’ is the positive control. Reproduced from [184] with permission of the Royal Society Publishing.

