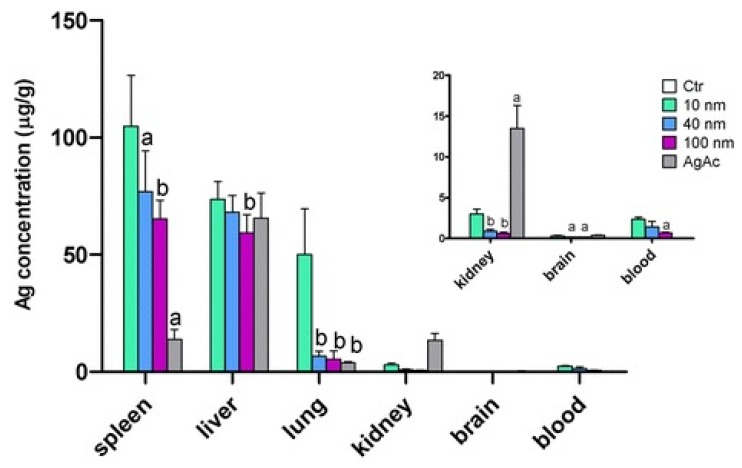
Figure 27.
Silver tissue concentration after i.v. injection of AgNPs and AgAc in mice. Data are expressed as means ± SD. The inset illustrates a magnified view showing Ag concentration in the kidney, brain, and blood. Statistical significance: a = p < 0.05; b = p < 0.01. Reproduced from [229], BioMed Central Ltd under the Creative Commons Attribution License.

