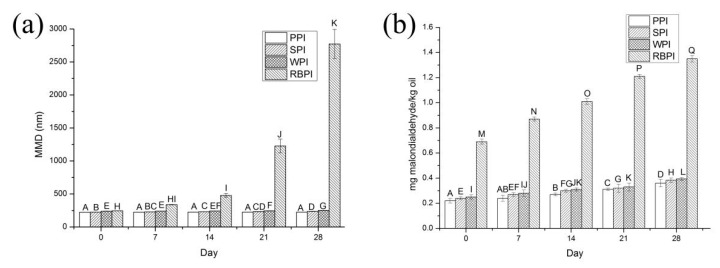
Figure 7.
Influence of storage time on MDD (a) and thiobarbituric acid-reactive substances (TBARS) values (b) of PPI, SPI, WPI, and RBPI-stabilized nanoemulsions. Samples designated with different uppercase letters (A), (B–D), (E–G), and (H–K) indicate significant difference (p < 0.05) when compared with different storage time on MDD of PPI, SPI, WPI, and RBPI -stabilized nanoemulsions, respectively. Samples designated with different upper case letters (A–D), (E–H), (I–L) and (M–Q) indicate significant difference (p < 0.05) when compared between different storage time on TBARS values of PPI, SPI, WPI, and RBPI-stabilized nanoemulsions, respectively. The PPI, RBPI, SPI, and WPI-stabilized nanoemulsions were fabricated under the circumstance of the different protein concentrations of PPI (2% w/v), RBPI (2% w/v), SPI (3% w/v), and WPI (4% w/v), corn oil (3%, 2%, 2%, 3% v/v, respectively), ultrasonic power 500 W and ultrasonic time 20 min.

