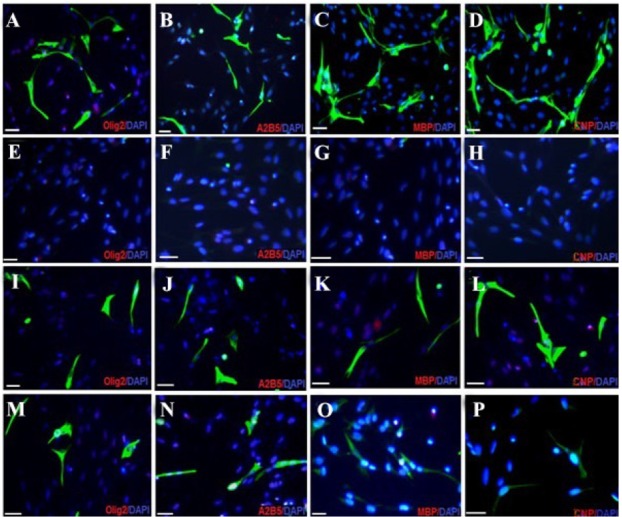
Figure 5.

Immunocytochemistry analysis of differentiated bone marrow stromal cells into oligodendrocyte like cells. Fluorescence images of oligoprogenitor markers (Olig2 and A2B5) and mature oligodendrocyte markers; (CNP and MBP) in experimental group (A-D); Negative Control 1 (E-H) Control 2 (I-L), and Control 3. (M-P). Scale bars 10 μm.
