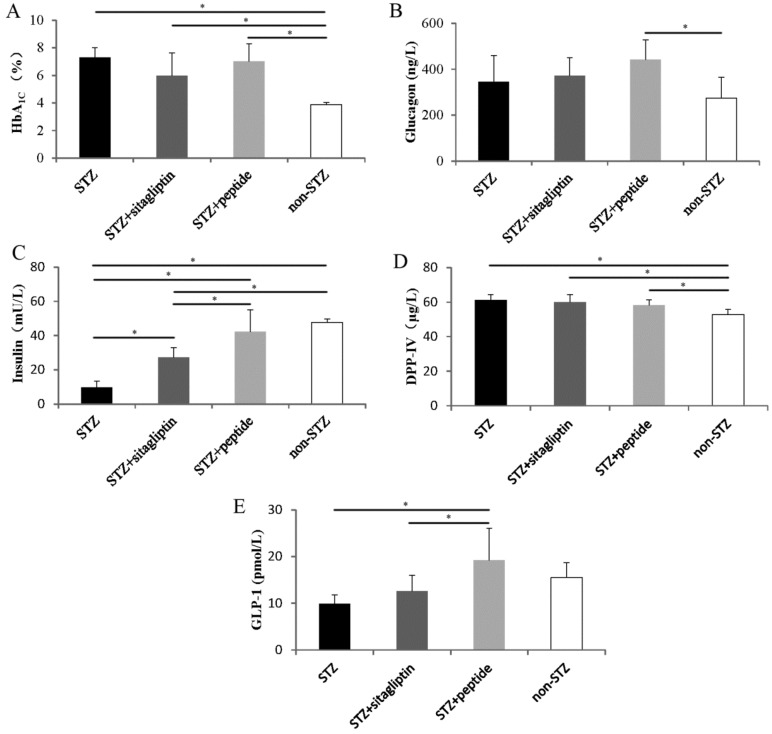
Figure 3.
Effect of daily DPP-IV inhibitor administration on the (A) HbA1c levels, (B) plasma glucagon levels, (C) plasma insulin levels at day 57, (D) DPP-IV concentrations, and (E) glucagon-like peptide-1 (GLP-1) concentrations. The black columns represent the STZ control mice (n = 9); the deep gray columns show STZ mice administrated with sitagliptin (n = 6); the light gray columns represent STZ mice administrated with synthetic peptide II (n = 7); and the white columns show the normal control (n = 10). Data are presented as means ± SD. Statistical significance: * p < 0.05.

