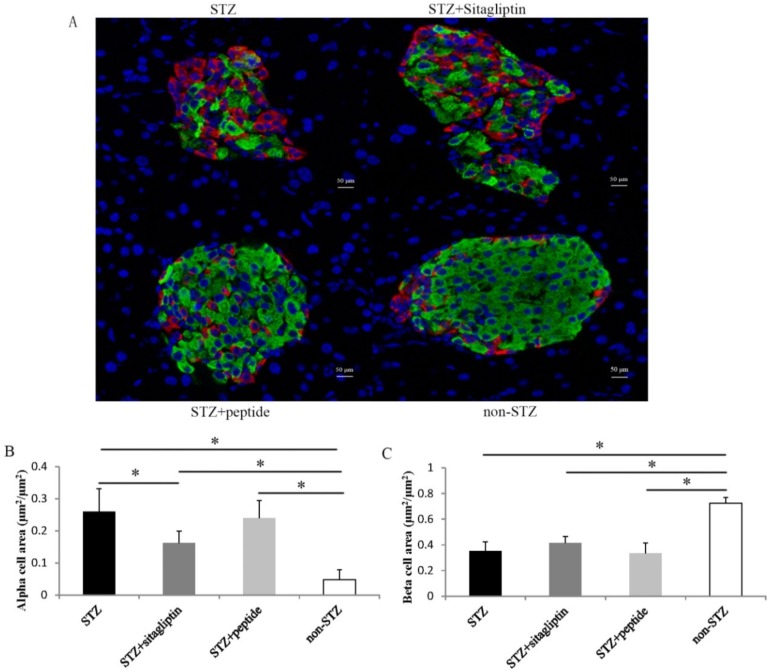
Figure 4.
Immunochemical analysis was investigated at day 57. (A) Pancreatic sections were stained with insulin (green), glucagon (red), with representative islets shown (scalebars: 50 μm; magnification: ×400). (B) Glucagon-positive (alpha) cell area per islet area. (C) Insulin-positive (beta) cell area per islet area. The data of the alpha and beta cell area are presented as means ± SE (Standard Error). Black columns show STZ control mice (n = 9); the deep gray columns show the STZ mice administrated with sitagliptin (n = 6); the light gray columns represent STZ mice administrated with synthetic peptide II (n = 7); and the white columns show the normal control (n = 10). Every islet executed three slices. Statistical significance: * p < 0.05.

