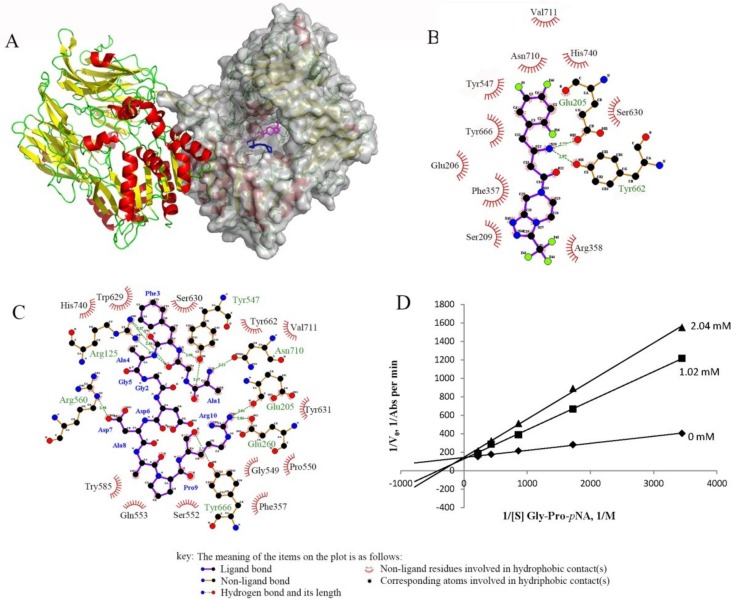
Figure 6.
(A) Molecular modeling of the interaction between DPP-IV (1X70) and its ligands: sitagliptin (magenta) and peptide II (blue). Chain B is shown as a surface in gray. The profiles of the binding sites of DPP-IV with (B) sitagliptin and (C) peptide II produced by LigPlot+ show the detailed interaction. (D) Lineweaver–Burk plot for DPP-IV activity in the absence and presence of peptide II with different inhibitory concentrations (0, 1.02, and 2.04 mM).

