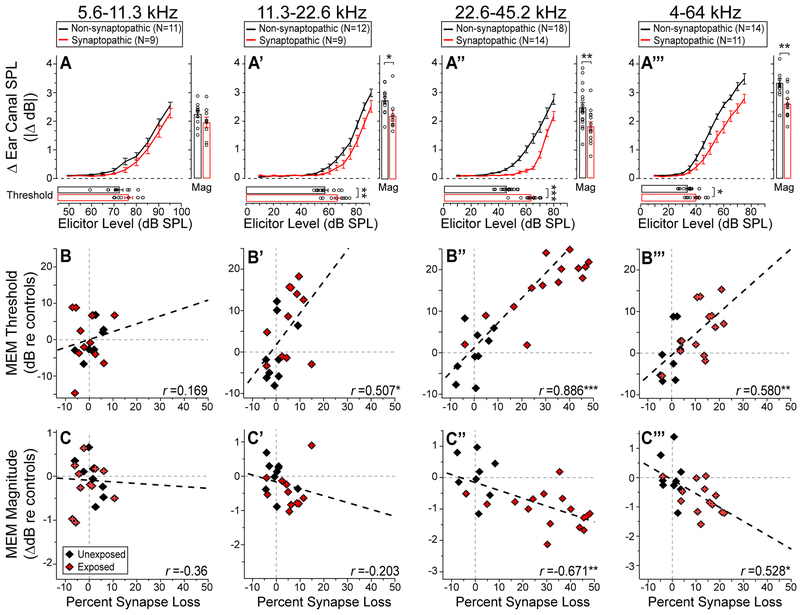
Figure 6. MEMRs were attenuated when the elicitor bandwidth spanned synaptopathic cochlear regions.
A-A’’’: Mean MEMR growth functions (±1 SEM) for four reflex elicitors, along with MEMR thresholds and magnitudes, displayed as in Figure 4. Comparisons are between synaptopathic and non-synaptopathic mice, with the latter group including all unexposed mice and two noise-exposed WT mice with no resultant synaptopathy. B-B’’’: MEMR thresholds, normalized to control means, plotted vs. the normalized synapse counts within the cochlear frequency region matching the elicitor passband. C-C’’’: MEMR maximum magnitude, normalized and plotted as in B-B’’’. For direct comparison, correlation coefficients for ABR wave-1 amplitude vs. synapse-loss (each averaged over the elicitor band width) was: r = 0.37, 0.24, and 0.56 for the octave-bands centered at 8, 16, and 32 kHz, respectively. Group sizes are given in panels A-A’’’ - histology was not available for all unexposed mice undergoing reflex testing, and such mice were excluded from these panels. Asterisks indicate statistical significance: * for P<.05; ** for P<.01; *** for P<.001

