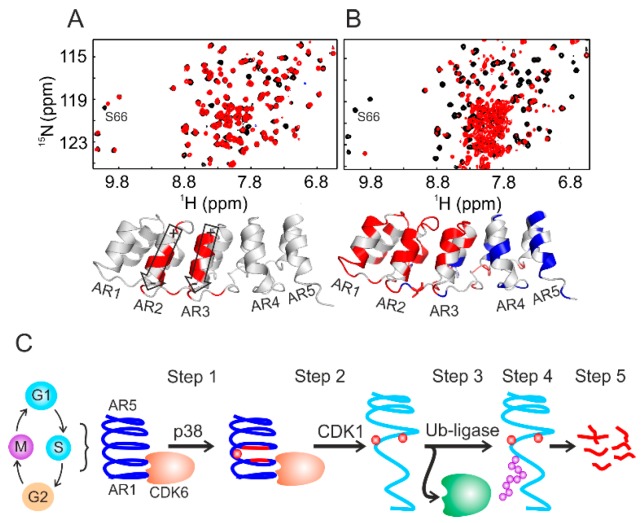
Figure 4.
Following cell lysate-induced protein phosphorylation using NMR spectroscopy. (A) Superposition of two-dimensional (2D) 1H–15N HSQC spectra of phosphorylated p19INK4d at Ser66 (red) and non-phosphorylated protein (black). (B) Superposition of 2D 1H–15N HSQC spectra of doubly phosphorylated p19INK4d at Ser66 and Ser76 (red) and the non-phosphorylated form (black). The bottom panels in (A) and (B) represent the backbone NMR chemical-shift mapping on the p19INK4d structure. (C) Summary of the fate of p19INK4d during the cell cycle controlled by phosphorylation and ubiquitination. This figure was adapted from Reference [24].

