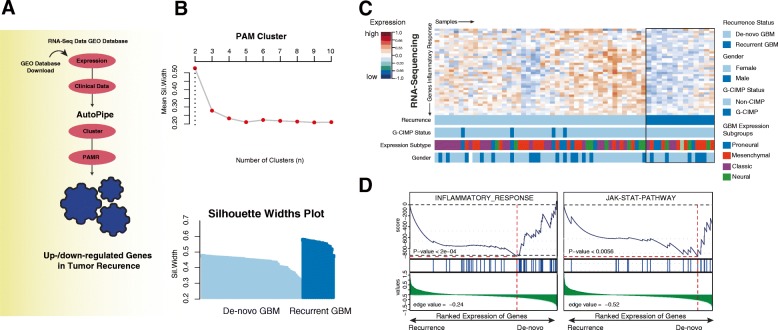
Fig. 1.
a Illustration of the workflow displaying the bioinformatical approach. b The upper panel shows a plot illustrating the optimal number of clusters. The optimal number of clusters was achieved by PAM clustering from 2 to 10 number of clusters by calculating the mean silhouette widths. In the bottom plot, the silhouette widths of both clusters are shown ordered by de-novo (light blue) and recurrent GBM (dark blue). c Heatmap of genes of the INFLAMMATORY RESPONSE (Hallmark genesets) based on the RNA-Sequencing data published by Bao and colleagues [23]. High and low gene expression levels are displayed in red and blue color, respectively. In the bottom panel of the heatmap, individual properties such as expression subgroup, CpG island methylation phenotype (CIMP) status and gender are shown. The explanation of each property is given on the right side. d Two plots displays a gene set enrichment analysis (GSEA) of pathways that were significantly downregulated in recurrent glioma

