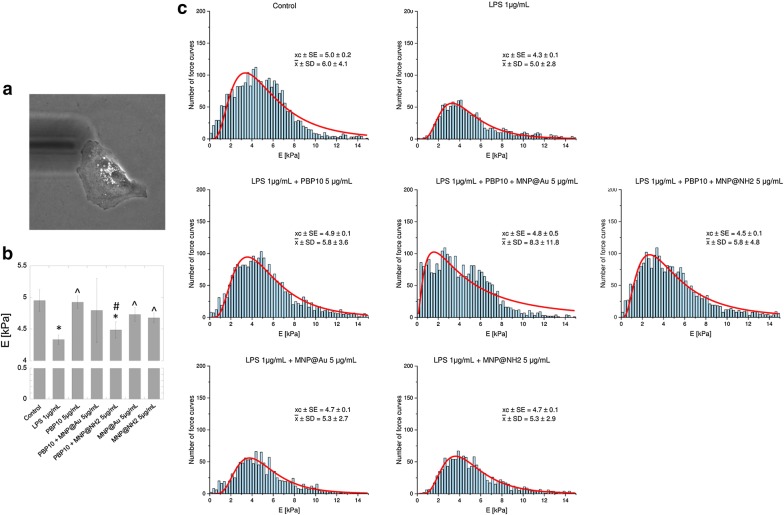
Fig. 7.
Changes in nanomechanical properties of LPS-stimulated cells determined by AFM using indentation depth value of 300 nm. Representative photograph of a single A549 cell probed using AFM working in force spectroscopy mode in liquid conditions (a). Summary of Young’s modulus analysis for cells treated with indicated agents at a dose of 5 µg/mL (b). Histograms presenting the distribution of force curves obtained from unstimulated cells, LPS-treated cells and endotoxin-stimulated cells incubated in the presence of PBP10 peptide and its magnetic derivatives are demonstrated in c. Results are presented as mean ± SD. * and ^indicate statistically significant (p ≤ 0.05) activity of tested agents compared to untreated control samples and LPS-stimulated cells, respectively. #Indicates statistical significance when comparing MNP-based agents to the non-immobilized peptide

