Fig. 1.

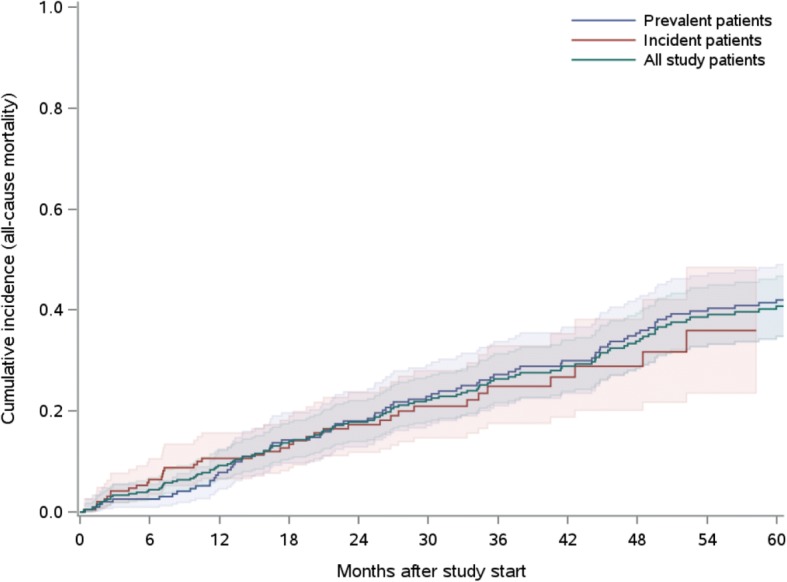
Plot showing the cumulative all-cause mortality incidences of prevalent (blue) and incident (red) patients as well as of the total study population (green)

Plot showing the cumulative all-cause mortality incidences of prevalent (blue) and incident (red) patients as well as of the total study population (green)