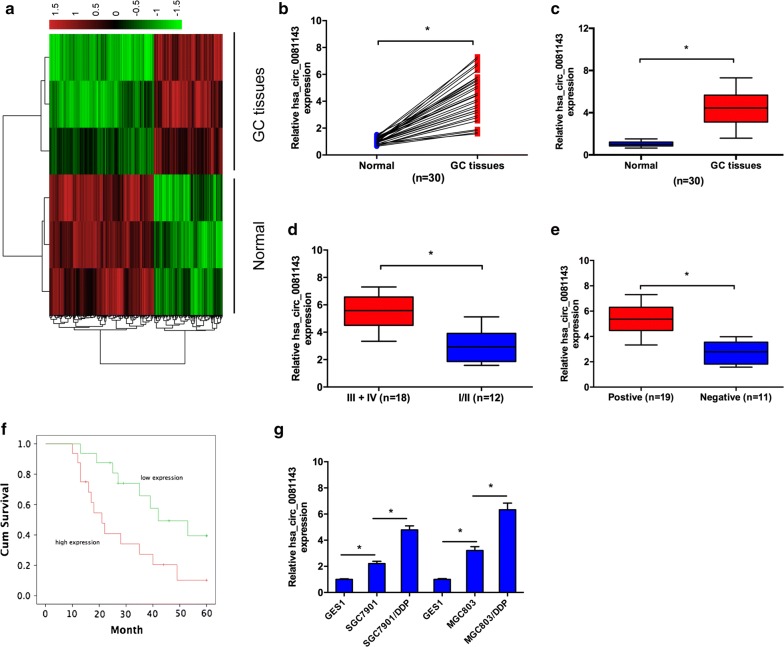
Fig. 1.
Hsa_circ_0081143 was increased in GC. a Heatmap of the most differentially expressed circRNAs in GC tissues compared to normal gastric tissues according to circRNA microarray dataset. b, c Relative expression of hsa_circ_0081143 in 30 pairs of GC tissues and adjacent non-tumor tissues by qRT-PCR. d Relative expression of hsa_circ_0081143 in GC tissues with different TNM stages. e Relative expression of hsa_circ_0081143 in GC tissues with lymphnode status. f Kaplan–Meier analysis showed that GC patients with high hsa_circ_0081143 expression have a poor prognosis. g Relative expression of hsa_circ_0081143 in SGC7901/DDP, MGC803/DDP, SGC7901, MGC803, and GES1 cells. *P < 0.05

