
Fig. 4.
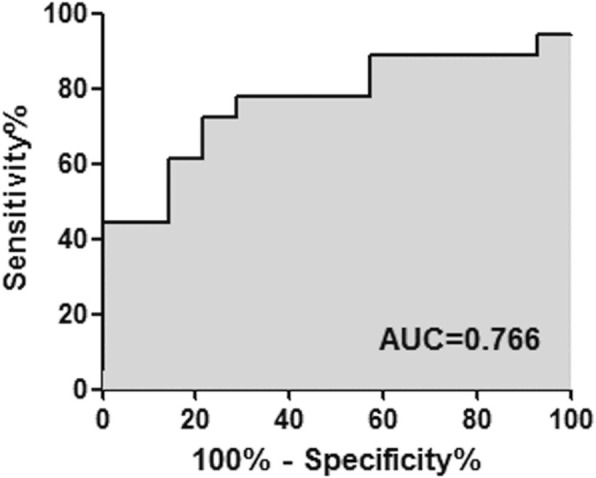
ROC curve analysis using ciRS-7 to distinguish RA patients. ROC curve analysis was performed to show the AUC of ciRS-7
Official websites use .gov
A
.gov website belongs to an official
government organization in the United States.
Secure .gov websites use HTTPS
A lock (
) or https:// means you've safely
connected to the .gov website. Share sensitive
information only on official, secure websites.
ROC curve analysis using ciRS-7 to distinguish RA patients. ROC curve analysis was performed to show the AUC of ciRS-7