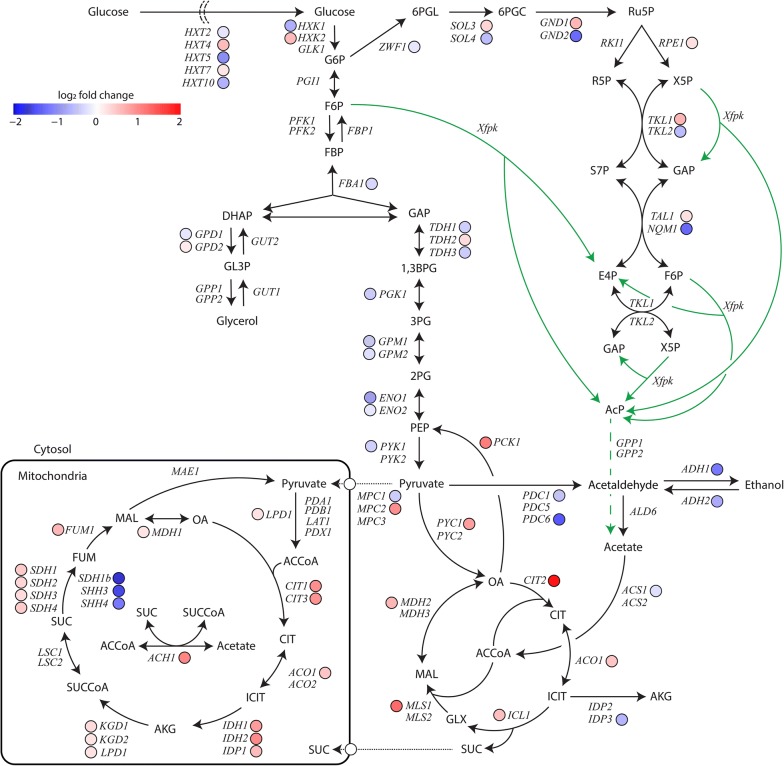
Fig. 4.
Transcriptional responses to phosphoketolase expression of central carbon metabolism genes expressed as log2-fold changes (padj < 0.01). Extent and type (down/up) of the fold change is indicated by shading of blue (down) and red (up) color. Samples were taken from glucose-limited chemostats in biological quadruplicates

